
Chinese Journal of Nursing ›› 2024, Vol. 59 ›› Issue (14): 1691-1697.DOI: 10.3761/j.issn.0254-1769.2024.14.004
• Special Planning-Heart Fuilure Care • Previous Articles Next Articles
WANG Weiyun( ), LIU Changhong, SUN Guozhen, TANG Yifan, LI Zhenyu, SU Ziwen, GU Zejuan()
Received:2023-11-03
Online:2024-07-20
Published:2024-07-11
Contact:
GU Zejuan
王蔚云(), 刘长红, 孙国珍, 汤一帆, 李珍宇, 苏子雯, 顾则娟()
通讯作者:
顾则娟
作者简介:王蔚云:女,硕士,护师,E-mail:crystalwwychina@163.com
基金资助:WANG Weiyun, LIU Changhong, SUN Guozhen, TANG Yifan, LI Zhenyu, SU Ziwen, GU Zejuan. The influence of cumulative fluid balance on volume status in patients with heart failure[J]. Chinese Journal of Nursing, 2024, 59(14): 1691-1697.
王蔚云, 刘长红, 孙国珍, 汤一帆, 李珍宇, 苏子雯, 顾则娟. 累积液体平衡量对心力衰竭患者容量状态影响的研究[J]. 中华护理杂志, 2024, 59(14): 1691-1697.
Add to citation manager EndNote|Ris|BibTeX
URL: http://zh.zhhlzzs.com/EN/10.3761/j.issn.0254-1769.2024.14.004
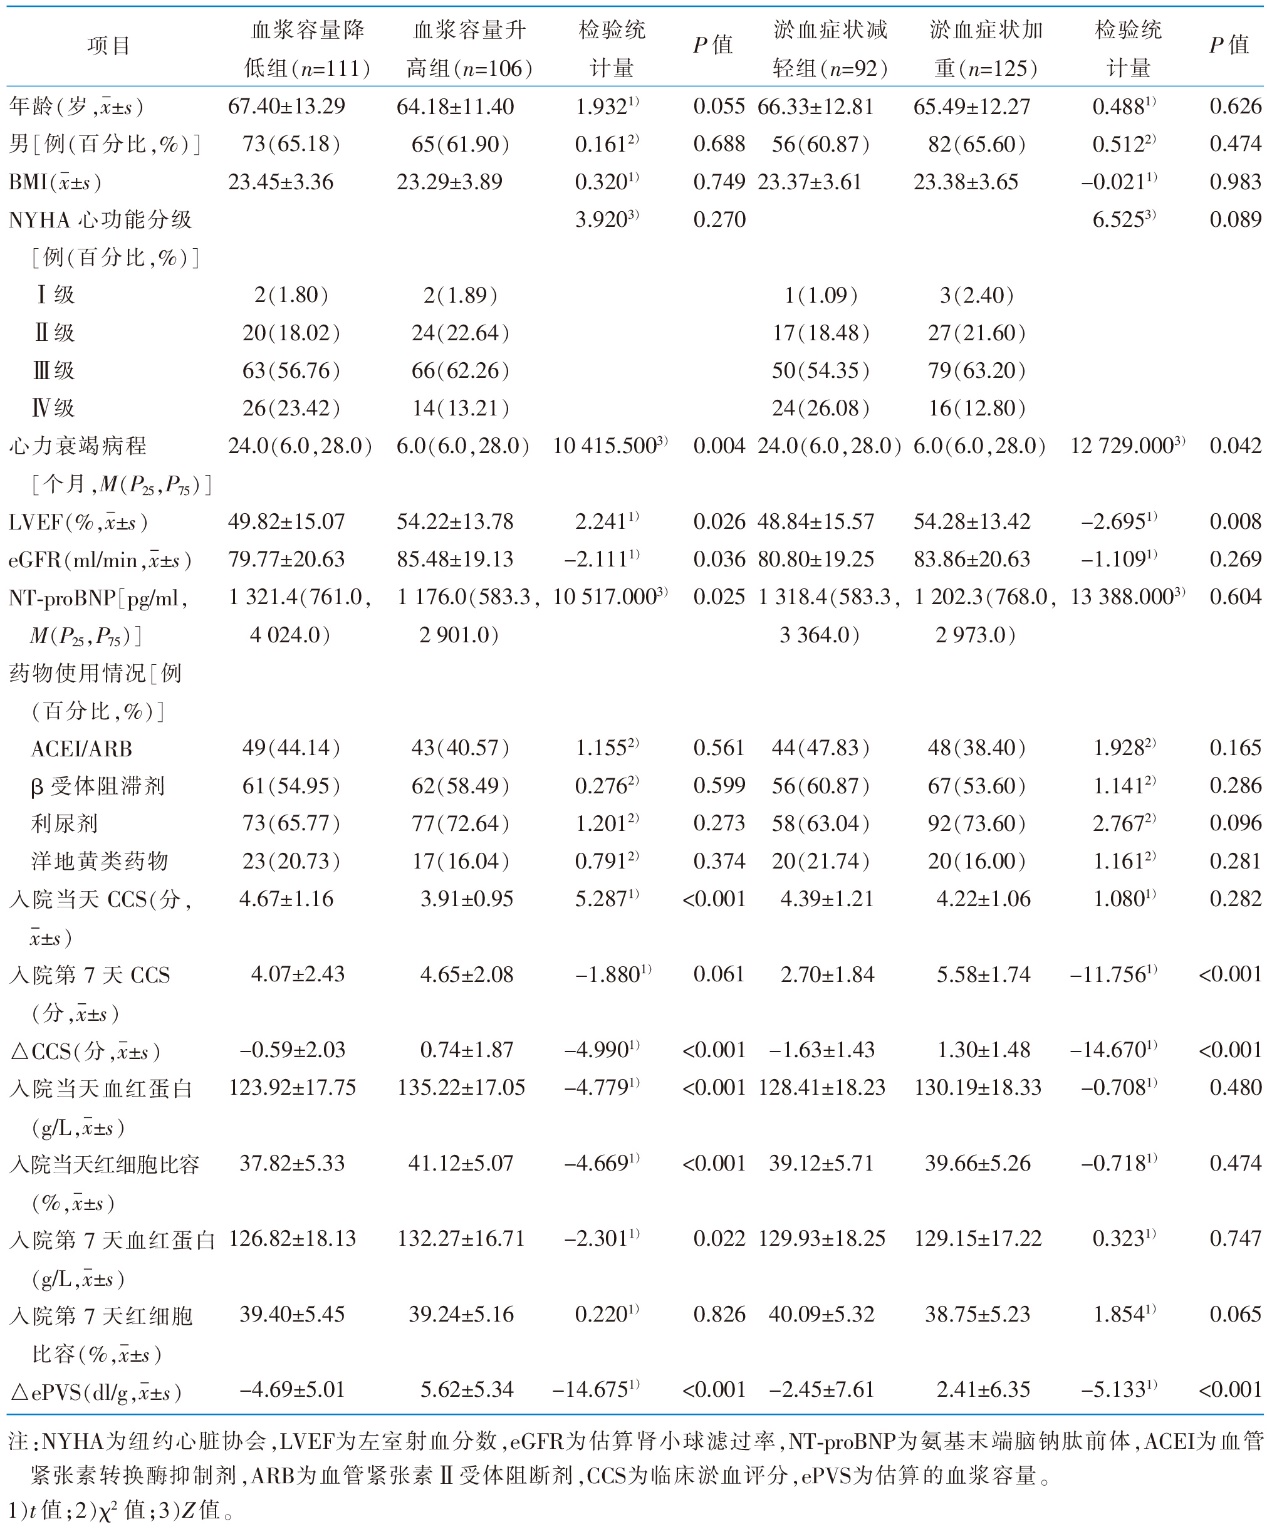 |
Table 1 General information and volume status of patients
| |
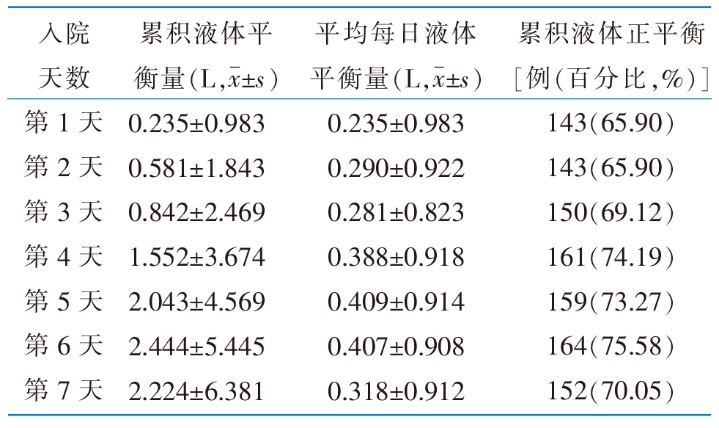 |
Table 2 Cumulative fluid balance at 1 to 7 d(n=217)
| |
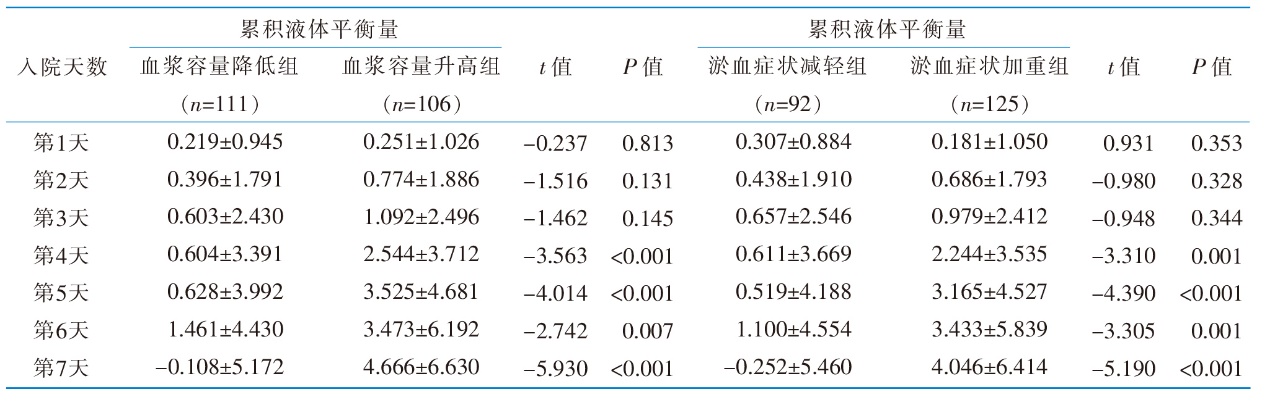 |
Table 3 Comparison of cumulative fluid balance in different groups at 1 to 7 d(L,$\bar{x}±s$)
| |
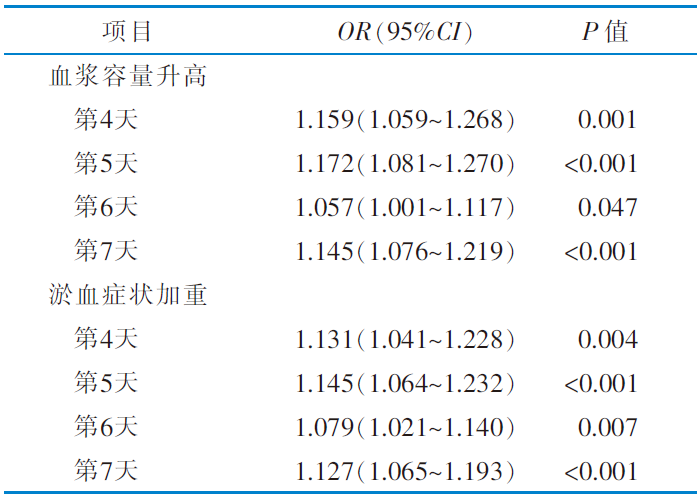 |
Table 4 Univariate and multivariate logistic regression analysis of the influence of cumulative fluid balance on the plasma volume and clinical congestion symptoms at 4 to 7 d(n=217)
| |
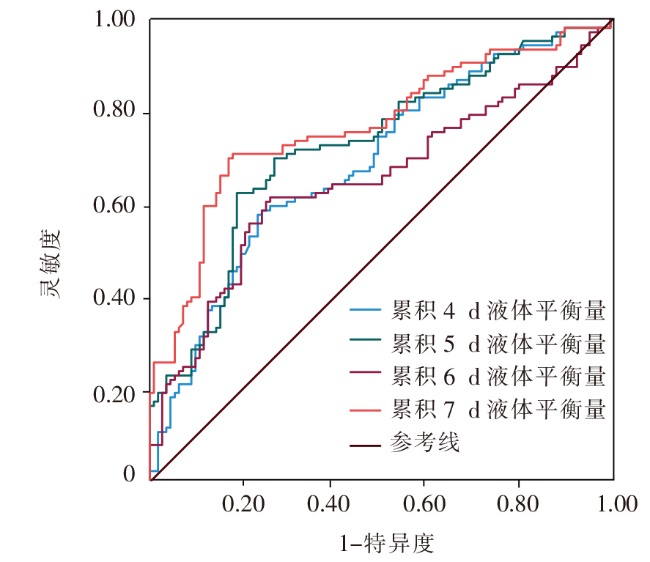
Figure 1 Receiver operating characteristic curve of cumulative fluid balance in prognosis of increasing plasma volume at 4 to 7 d
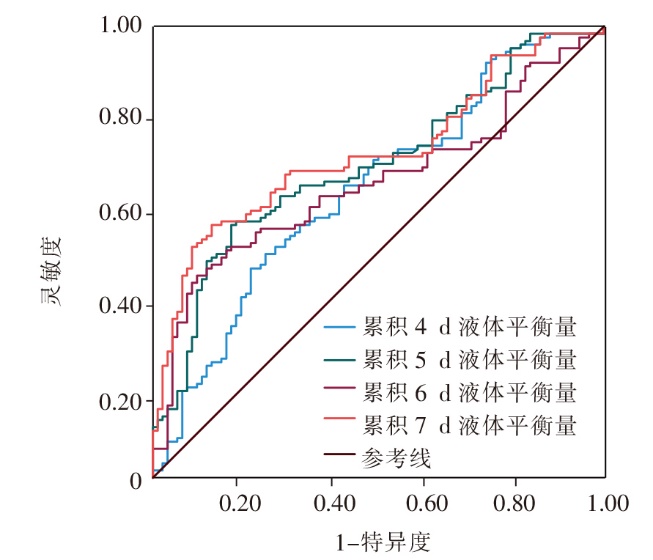
Figure 2 Receiver operating characteristic curve of cumulative fluid balance in prognosis of aggravated clinical congestion status at 4 to 7 d
| [1] | 马丽媛, 吴亚哲, 王文, 等. 《中国心血管病报告2017》要点解读[J]. 中国心血管杂志, 2018, 23(1):3-6. |
| Ma LY, Wu YZ, Wang W, et al. Interpretation of the report on cardiovascular diseases in China(2017)[J]. Chin J Cardiovasc Med, 2018, 23(1):3-6. | |
| [2] |
罗桢蓝, 龚静欢, 朱凌燕. 心力衰竭患者液体管理的研究进展[J]. 中华护理杂志, 2021, 56(3):473-477.
DOI URL |
|
Luo ZL, Gong JH, Zhu LY. Research progress of fluid management strategies in patients with heart failure[J]. Chin J Nurs, 2021, 56(3):473-477.
DOI URL |
|
| [3] | de la Espriella R, Cobo M, Santas E, et al. Assessment of filling pressures and fluid overload in heart failure:an updated perspective[J]. Rev Esp Cardiol, 2023, 76(1):47-57. |
| [4] | Ruste M, Chabanol C, Fellahi JL, et al. Bioelectrical impedance analysis during deresuscitation:correlation and agreement with cumulative fluid balance in ICU patients[J]. J Clin Monit Comput, 2023, 37(2):679-687. |
| [5] | Huang AC, Lee TY, Ko MC, et al. Fluid balance correlates with clinical course of multiple organ dysfunction syndrome and mortality in patients with septic shock[J]. PLoS One, 2019, 14(12):e0225423. |
| [6] | Heidenreich PA, Bozkurt B, Aguilar D, et al. 2022 AHA/ACC/HFSA guideline for the management of heart failure:a report of the American College of Cardiology/American Heart Association Joint Committee on clinical practice guidelines[J]. J Am Coll Cardiol, 2022, 79(17):e263-e421. |
| [7] | 黎永艳, 张海霞, 邱棋伟. 水分测定仪测定食品中水分的含量[J]. 医学动物防制, 2011, 27(9):880-881. |
| Li YY, Zhang HX, Qiu QW. Determination water content in food by moisture test apparatus[J]. J Med Pest Contr, 2011, 27(9):880-881. | |
| [8] |
O’Donnell LJ, Virjee J, Heaton KW. Detection of pseudodiarrhoea by simple clinical assessment of intestinal transit rate[J]. BMJ, 1990, 300(6722):439-440.
DOI PMID |
| [9] |
黄月华, 谭嘉敏, 庄水冰, 等. 1例原发性高草酸盐尿症患者行肝肾联合移植术后的液体管理[J]. 中华护理杂志, 2021, 56(7):1058-1061.
DOI URL |
|
Huang YH, Tan JM, Zhuang SB, et al. Fluid management and nursing care of a primary hyperoxaluria patient received combined liver and kidney transplantation[J]. Chin J Nurs, 2021, 56(7):1058-1061.
DOI URL |
|
| [10] |
Strauss MB, Davis RK, Rosenbaum JD, et al. Water diuresis produced during recumbency by the intravenous infusion of isotonic saline solution[J]. J Clin Invest, 1951, 30(8):862-868.
DOI PMID |
| [11] |
Rohde LE, Beck-da-Silva L, Goldraich L, et al. Reliability and prognostic value of traditional signs and symptoms in outpatients with congestive heart failure[J]. Can J Cardiol, 2004, 20(7):697-702.
PMID |
| [12] | Hatton GE, Du RE, Wei SY, et al. Positive fluid balance and association with post-traumatic acute kidney injury[J]. J Am Coll Surg, 2020, 230(2):190-199.e1. |
| [13] | Margolis G, Kofman N, Gal-Oz A, et al. Relation of positive fluid balance to the severity of renal impairment and recovery among ST elevation myocardial infarction complicated by cardiogenic shock[J]. J Crit Care, 2017,40:184-188. |
| [14] |
赵旭, 王伟, 赵小静, 等. 慢性心力衰竭患者出入量管理的最佳证据总结[J]. 中华护理杂志, 2020, 55(3):456-461.
DOI URL |
|
Zhao X, Wang W, Zhao XJ, et al. Best evidence summary for management of output and input in chronic heart failure patients[J]. Chin J Nurs, 2020, 55(3):456-461.
DOI URL |
|
| [15] |
罗桢蓝, 胡三莲, 朱凌燕, 等. 慢性心力衰竭患者自我容量管理的最佳证据总结[J]. 中华护理杂志, 2022, 57(7):880-886.
DOI URL |
|
Luo ZL, Hu SL, Zhu LY, et al. Evidence summary for self volume-management in patients with chronic heart failure[J]. Chin J Nurs, 2022, 57(7):880-886.
DOI URL |
|
| [16] | 曾立霞, 廖浩, 杨明. 出入量差值动态观察与患者急性左心衰发生的探讨[J]. 浙江临床医学, 2013, 15(11):1695-1696. |
| Zeng LX, Liao H, Yang M. Dynamic observation of the differ-ence between inflow and outflow and discussion on the oc-currence of acute left heart failure in patients[J]. Zhejiang Clin Med J, 2013, 15(11):1695-1696. | |
| [17] | Hyun DG, Ahn JH, Huh JW, et al. Impact of a cumulative positive fluid balance during the first three ICU days in patients with sepsis:a propensity score-matched cohort study[J]. Ann Intensive Care, 2023, 13(1):105. |
| [18] | Kuwahara K. The natriuretic peptide system in heart failure:diagnostic and therapeutic implications[J]. Pharmacol Ther, 2021,227:107863. |
| [19] | Miller WL. Fluid volume homeostasis in heart failure:a tale of 2 circulations[J]. J Am Heart Assoc, 2022, 11(18):e026668. |
| [20] | Luo YJ, Wang T. What is the upper limitation of volume in Chinese peritoneal dialysis patients?[J]. Blood Purif, 2011, 31(4):289-295. |
| [21] | Wizemann V, Wabel P, Chamney P, et al. The mortality risk of overhydration in haemodialysis patients[J]. Nephrol Dial Transplant, 2009, 24(5):1574-1579. |
| [1] | SHEN Zhijia, CHEN Xinyu, QIAN Zhijie, YIN Limei. Behavioral characteristics of patients with recurrent hypoglycemia in the degeneracy of blood glucose management:a mixed-methods study [J]. Chinese Journal of Nursing, 2024, 59(9): 1043-1050. |
| [2] | WANG Limei, LI Lu, LI Yuxia, YU Peng, LUO Qian, ZHANG Chongni. The status and influencing factors of kinesiophobia in patients with diabetic peripheral neuropathic pain [J]. Chinese Journal of Nursing, 2024, 59(9): 1051-1056. |
| [3] | DING Huimin, DAI Limin, CAI Dongqing, YANG Qun. Potential profile analysis and influencing factors of self-management in prediabetic patients [J]. Chinese Journal of Nursing, 2024, 59(9): 1057-1064. |
| [4] | LIU Haiting, WANG Yongmei, ZHENG Beibei, CAI Lili, YE Linbin, WU Jiayun, NING Li, LI Yimin, CHEN Weixia. Development and reliability and validity test of a Self-Assessment Scale for Medication Literacy in Patients with Coronary Heart Disease Comorbidity Diabetes [J]. Chinese Journal of Nursing, 2024, 59(9): 1065-1071. |
| [5] | Allergy and Clinical Immunology Committee of Chinese Research Hospital Association, Allergy Care Group, Chinese Society of Allergology, Chinese Medical Association, Allergy Prevention and Control Committee of Chinese Preventive Medicine Association, (Writing Committee:WANG Qing, LIU Jun, ZHI Fan, WAN Wenjin, TIAN Fengying, HUO Xiaopeng, ZHOU Wenhua YANG Yongshi, WANG Tiantian, SUN Jinlü). Nursing expert consensus on subcutaneous injection for allergen-specific immunotherapy [J]. Chinese Journal of Nursing, 2024, 59(9): 1080-1083. |
| [6] | LI Qi, SU Qingqing, ZHANG Yaoyao, WANG Tiantian, LÜ Jing, LI Yake, LI Haiyan. A study on the trajectory and influencing factors of joint awareness in patients with total knee arthroplasty [J]. Chinese Journal of Nursing, 2024, 59(9): 1084-1090. |
| [7] | LIU Ya, LIU Xiaoqing, YANG Xuening, WANG Ping, LIU Xuekui, LUO Dan. Construction and validation of a risk predictive model for the bowel preparation failure in colonoscopy patients [J]. Chinese Journal of Nursing, 2024, 59(9): 1091-1098. |
| [8] | LI Xuqin, FENG Jiehui, HUANG Fangfang, YU Chao, LIANG Shiyu, WANG Xiao, LI Xufang, ZHU Han. Nursing care of a patient before operation with mechanical circulation-assisted bridging heart transplantation [J]. Chinese Journal of Nursing, 2024, 59(9): 1114-1117. |
| [9] | JIA Xiaojing, CHEN Yizhu, XU Zhiying, HE Xia, GENG Chao. Nursing care of a patient with acute myocardial infarction after double knee joint replacement due to alkaptonuria [J]. Chinese Journal of Nursing, 2024, 59(9): 1118-1121. |
| [10] | CUI Yishuang, HE Xifei, WANG Zhaozhao, CHENG Jie, YANG Weimei, LU Lijuan. Shared decision making in acute coronary syndromes:a scoping review [J]. Chinese Journal of Nursing, 2024, 59(9): 1145-1152. |
| [11] | YU Liangmeng, YU Xiaoling, LI Jiamei, RUAN Xiaofen. Application progress of evidence mapping in nursing field [J]. Chinese Journal of Nursing, 2024, 59(8): 1021-1025. |
| [12] | GUO Miaomiao, YAN Tingting, XU Dandan, YUAN Ling. Development and application of a whole course management information system for breast cancer [J]. Chinese Journal of Nursing, 2024, 59(8): 901-908. |
| [13] | QIAO Wenbo, HOU Sijia, ZHU Keping, LI Yaqin, WU Siyuan, QI Ziyi, WANG Wei. Construction and application of a pelvic floor muscle training program for patients with radical prostatectomy [J]. Chinese Journal of Nursing, 2024, 59(8): 909-915. |
| [14] | LU Ping, WANG Xiaojie, GUO Hailing. Correlation between preoperative frailty and short-term postoperative complications in elderly breast cancer patients [J]. Chinese Journal of Nursing, 2024, 59(8): 916-921. |
| [15] | YOU Chaoxiang, JIA Mengying, LI Shuang, CHEN Lili, JING Wendan, KOU Hongyan. A study of longitudinal trajectories and predictive factors of symptom clusters in patients with laparoscopic anal preservation surgery for rectal cancer [J]. Chinese Journal of Nursing, 2024, 59(8): 922-929. |
| Viewed | ||||||
|
Full text |
|
|||||
|
Abstract |
|
|||||